2026 Stock Derivatives Explosive Growth: The Landscape of Cryptocurrency Exchanges and Key Trends | RootData Research
 Core Viewpoint

 This report is based on the RootData stock derivatives exchange ranking system, analyzing the trends and pattern evolution of the sector from multiple dimensions.
Author: RootData
Introduction
In 2026, stock derivatives are rising from the periphery of the cryptocurrency market to become one of its core engines.
According to monitoring data from RootData on mainstream sample exchanges, from January to August 2026 (data as of the 25th), the cumulative trading volume of stock derivatives (contracts) reached nearly $1.75 trillion, with monthly trading volume increasing from $10 billion in January to over $60 billion. After the market focus quickly shifted from precious metals like gold and silver to stock assets such as U.S. and Korean stocks, stock derivatives have become the strongest growth driver for cryptocurrency exchanges' TradFi business.
As cryptocurrency exchanges capitalize on the dividends from stock assets, a new round of competition has emerged. This report, based on RootData's exchange ranking system, conducts a horizontal comparison of four core exchanges—Binance, OKX, Bitget, and Bybit—across five dimensions: trading volume, open interest, market depth, trading costs, and product matrix, analyzing the competitive barriers and evolution of the stock derivatives sector.
I. Overview of the Stock Derivatives Market
1.1 Monthly Average Trading Volume: From Billions to Hundreds of Billions
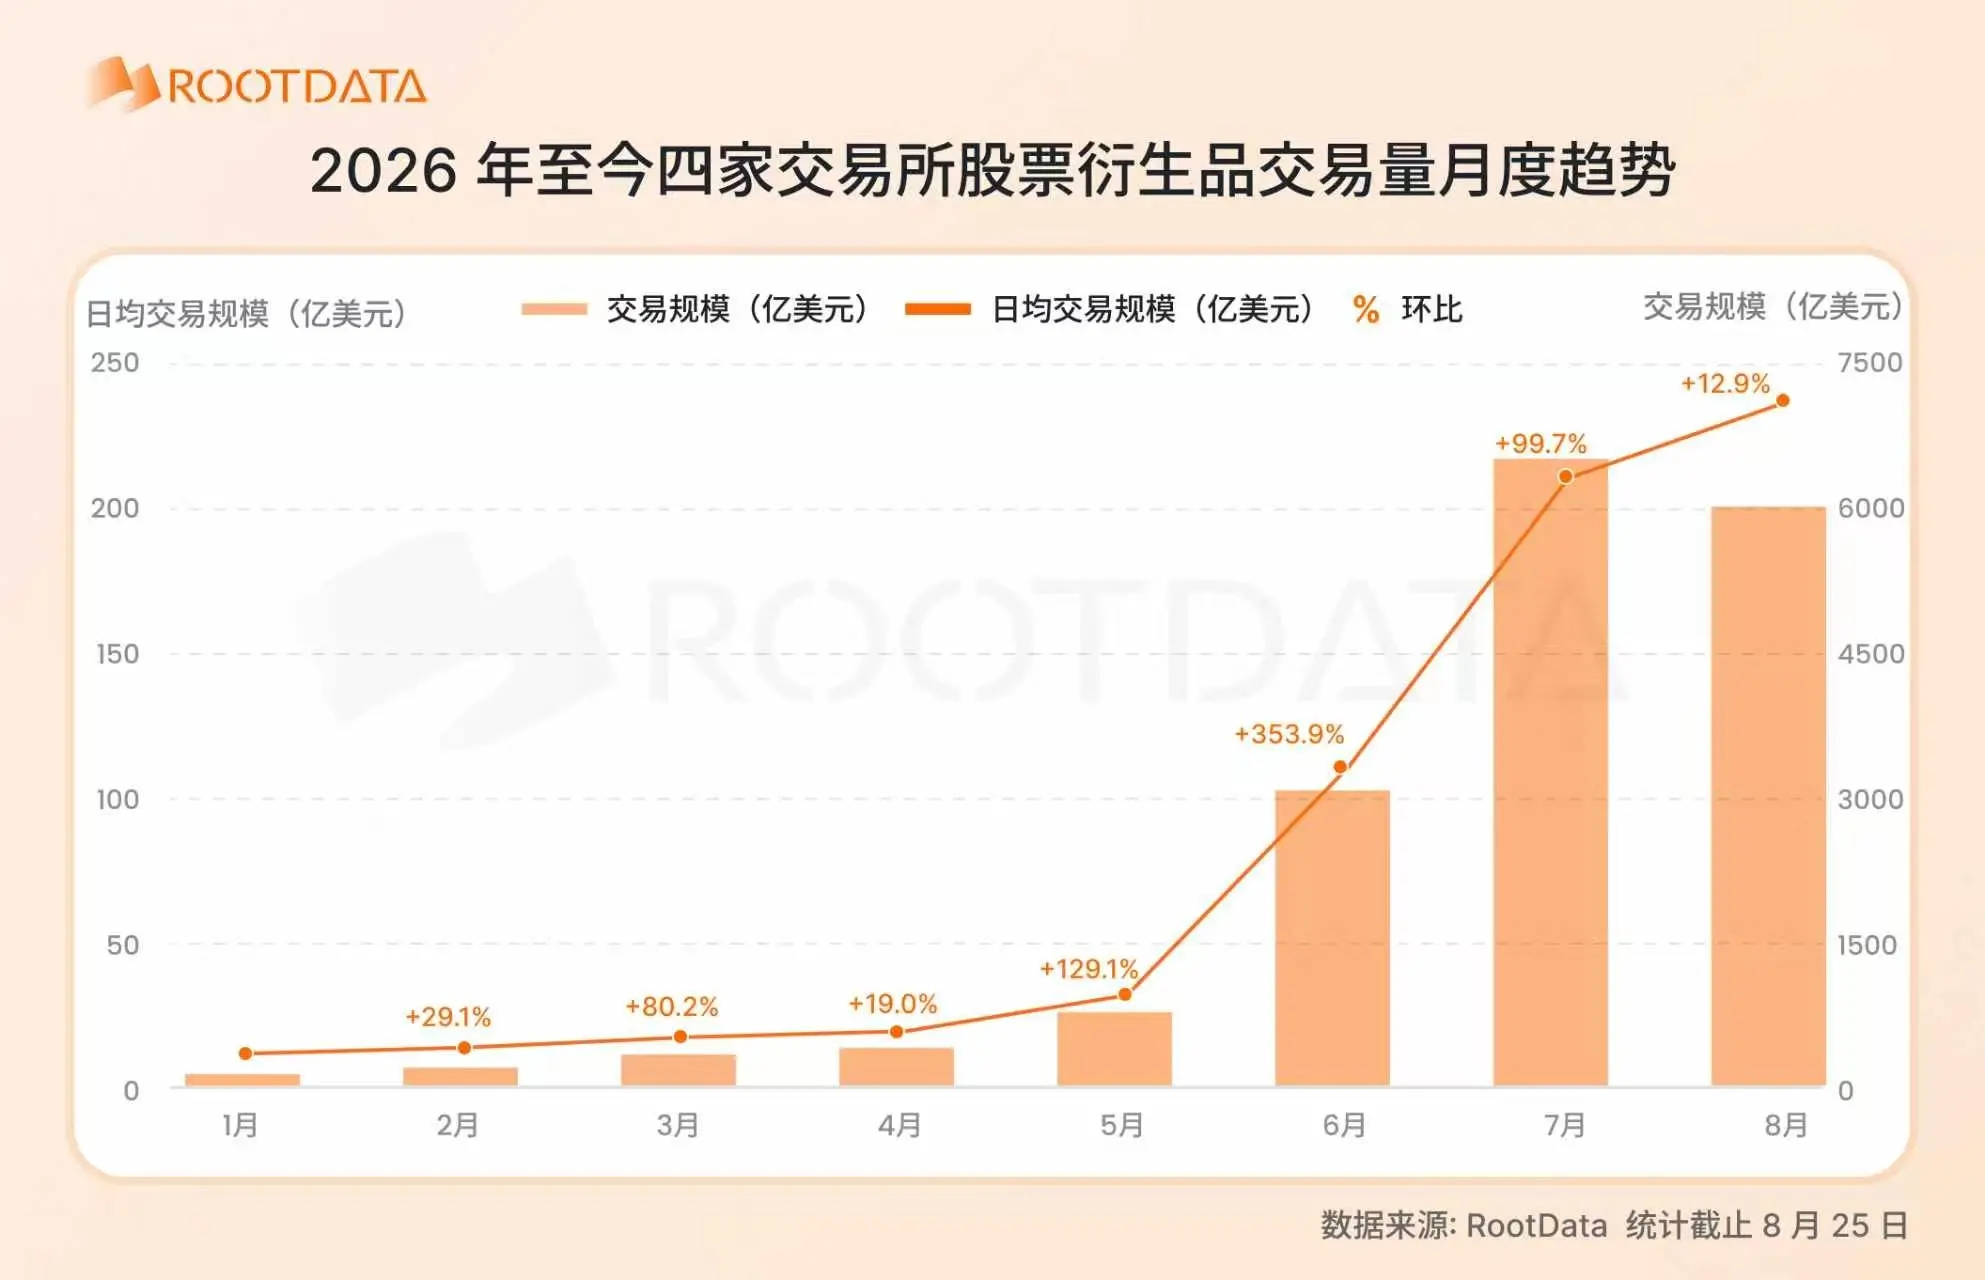
From January to August 2026, the trading volume of stock derivatives has shown a growth curve that transitioned from steady ascent to steep explosion. According to RootData's monitoring of mainstream sample exchanges, the total trading volume in January was approximately $11.6 billion, which then expanded month by month, reaching $73.3 billion in May. In June, the average daily trading volume surged by 353.9% month-over-month, driving the total for the month to $322 billion; July's total doubled again to $664.4 billion, setting new highs for the year; August (as of the 25th) remained above $600 billion, indicating that growth momentum has not waned.
The latest round of growth is primarily driven by the market for AI hardware such as storage chips. Starting in late June, contracts for targets like SanDisk (SNDK), SK Hynix (SKHYNIX), and Micron (MU) saw concentrated volume across the market, coupled with the intensive listing of stock and leveraged ETF contracts by leading exchanges in July and August, which collectively pushed up trading volume through supply and demand resonance.
From cumulative data, the total trading volume of stock derivatives from January to August is approximately $1.75 trillion, with the monthly volume center rising from less than $12 billion at the beginning of the year to over $60 billion; July's single-month volume was about 57 times that of January. This leap indicates that stock derivatives have rapidly entered the mainstream trading landscape from the periphery.
1.2 Stock Derivatives Dominate the TradFi Sector
Stock derivatives have transformed from a supporting role in TradFi to a leading one. Their share in the entire TradFi sector has steadily increased; at the beginning of the year, when precious metals dominated, the trading volume of stock derivatives accounted for less than 20% of the entire TradFi sector; as global stock markets such as U.S. and Korean stocks strengthened, funds quickly migrated to stock derivatives. By June, the trading volume of stock derivatives accounted for more than half of the TradFi sector for the first time, approaching 75%, and exceeded 80% in July and August, officially completing the transition from a supporting role to a leading one.
The rhythm of leading platforms also confirms this trend, as stock derivatives are becoming a regular trading choice for platform users rather than just "novelty products." Binance has disclosed that 47% of its bStocks trading occurs outside regular U.S. trading hours, indicating that trading demand is no longer dependent on traditional stock market opening times but has become an independent product for crypto users to trade around the clock; on Bitget, about one in three contract trades comes from stock perpetual contracts, and weekend trading volume for U.S. stock tokens has increased tenfold at one point, further demonstrating the rapid release of crypto users' demand to participate in the U.S. stock market 24/7. Stock derivatives are gradually becoming an important component of the trading ecosystem on platforms.
From open interest data, the popular stock assets in the crypto market are largely in sync with those in traditional markets, with the scale of popular assets like storage rapidly expanding. By the end of July, SK Hynix (SKHYNIX) saw its open interest surge first, reaching a peak of $875 million; by mid-August, SpaceX (SPCX) and SanDisk (SNDK) reached open interest peaks of approximately $910 million and $1.73 billion, respectively.
II. Competitive Landscape: Multi-Dimensional Comparison of Core Exchanges
In terms of the competitive landscape among exchanges, RootData combines its stock derivatives exchange rankings to compare the stock derivatives data of the following four core exchanges across dimensions such as trading volume, open interest, depth, price spread, and asset count.
2.1 Trading Volume: Significant Head Concentration Effect
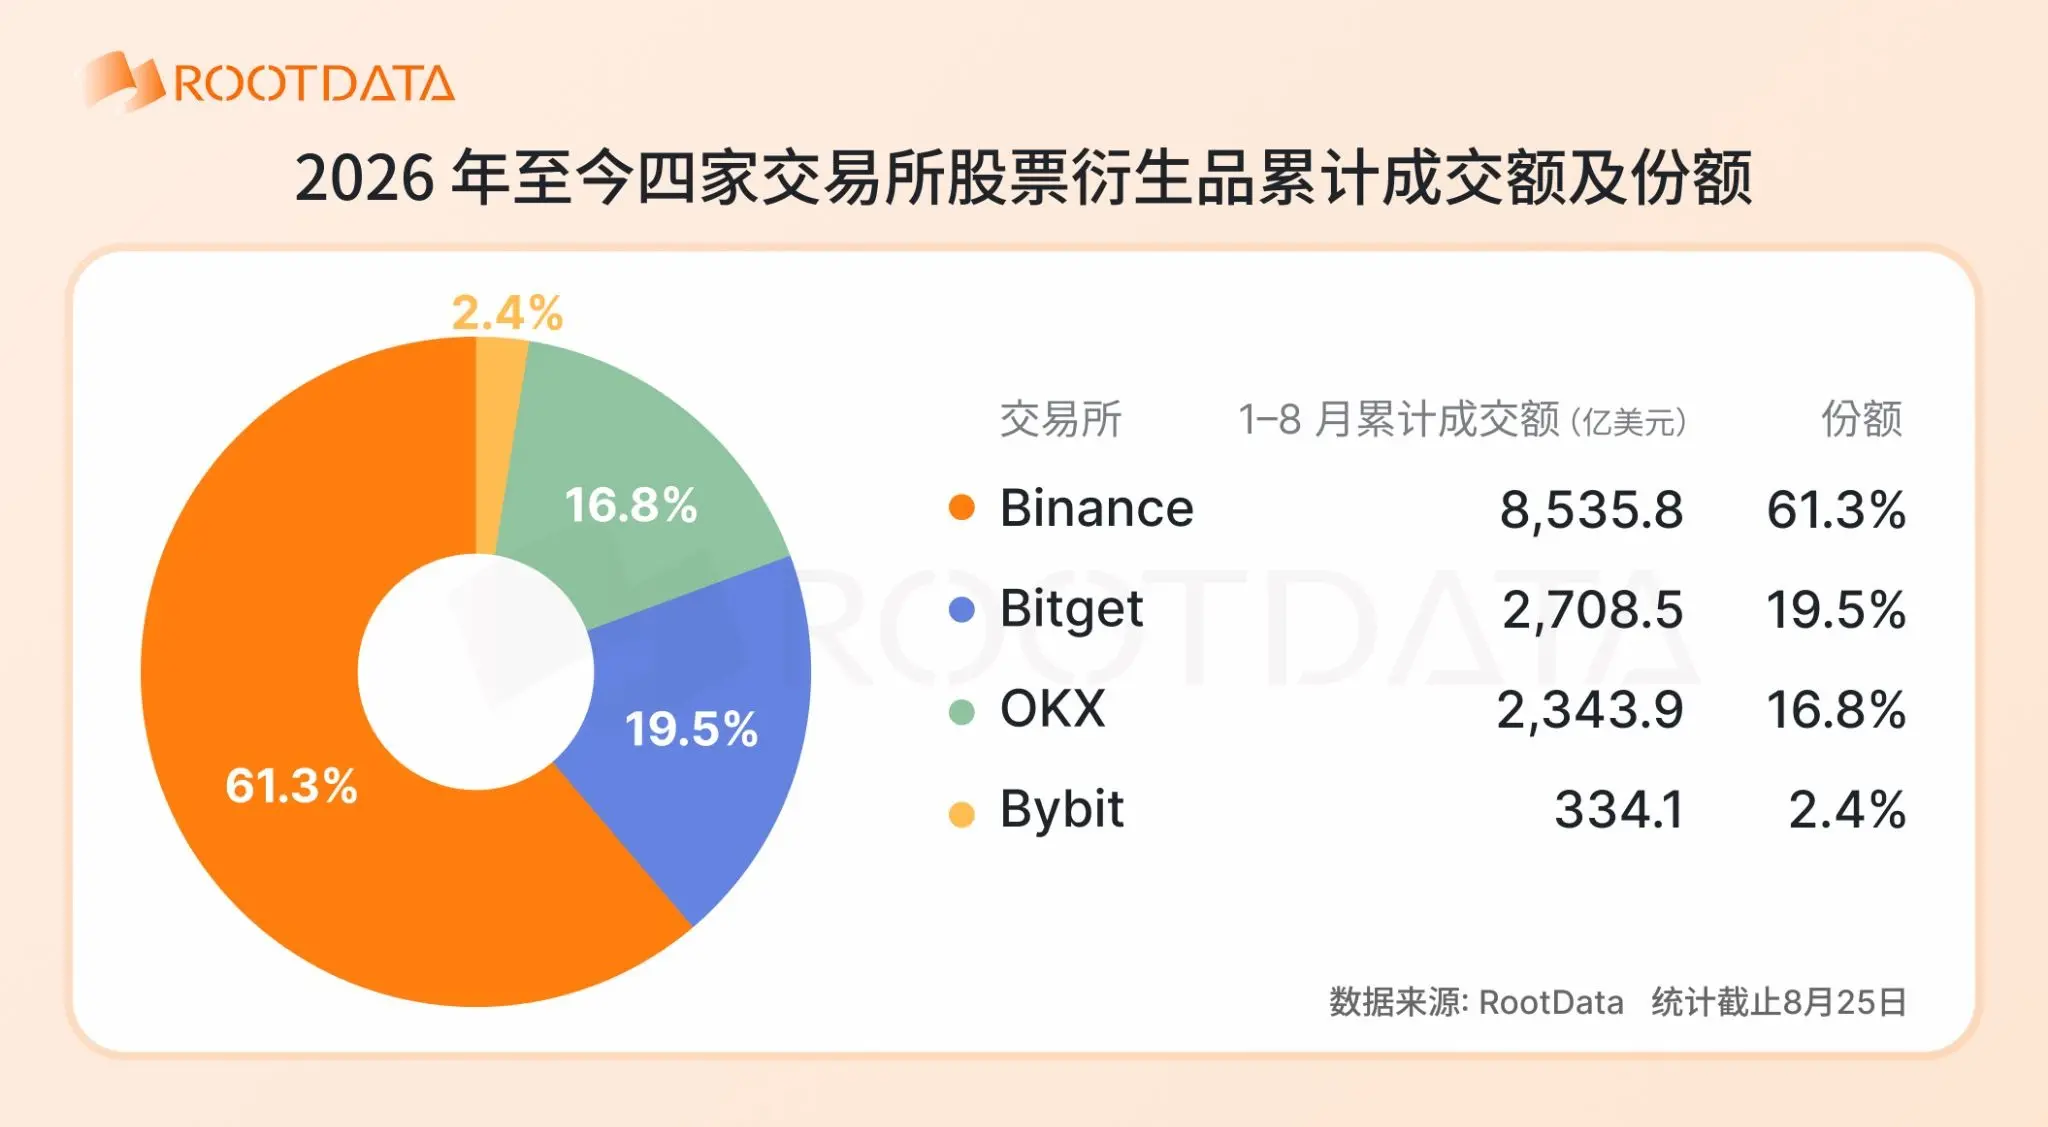
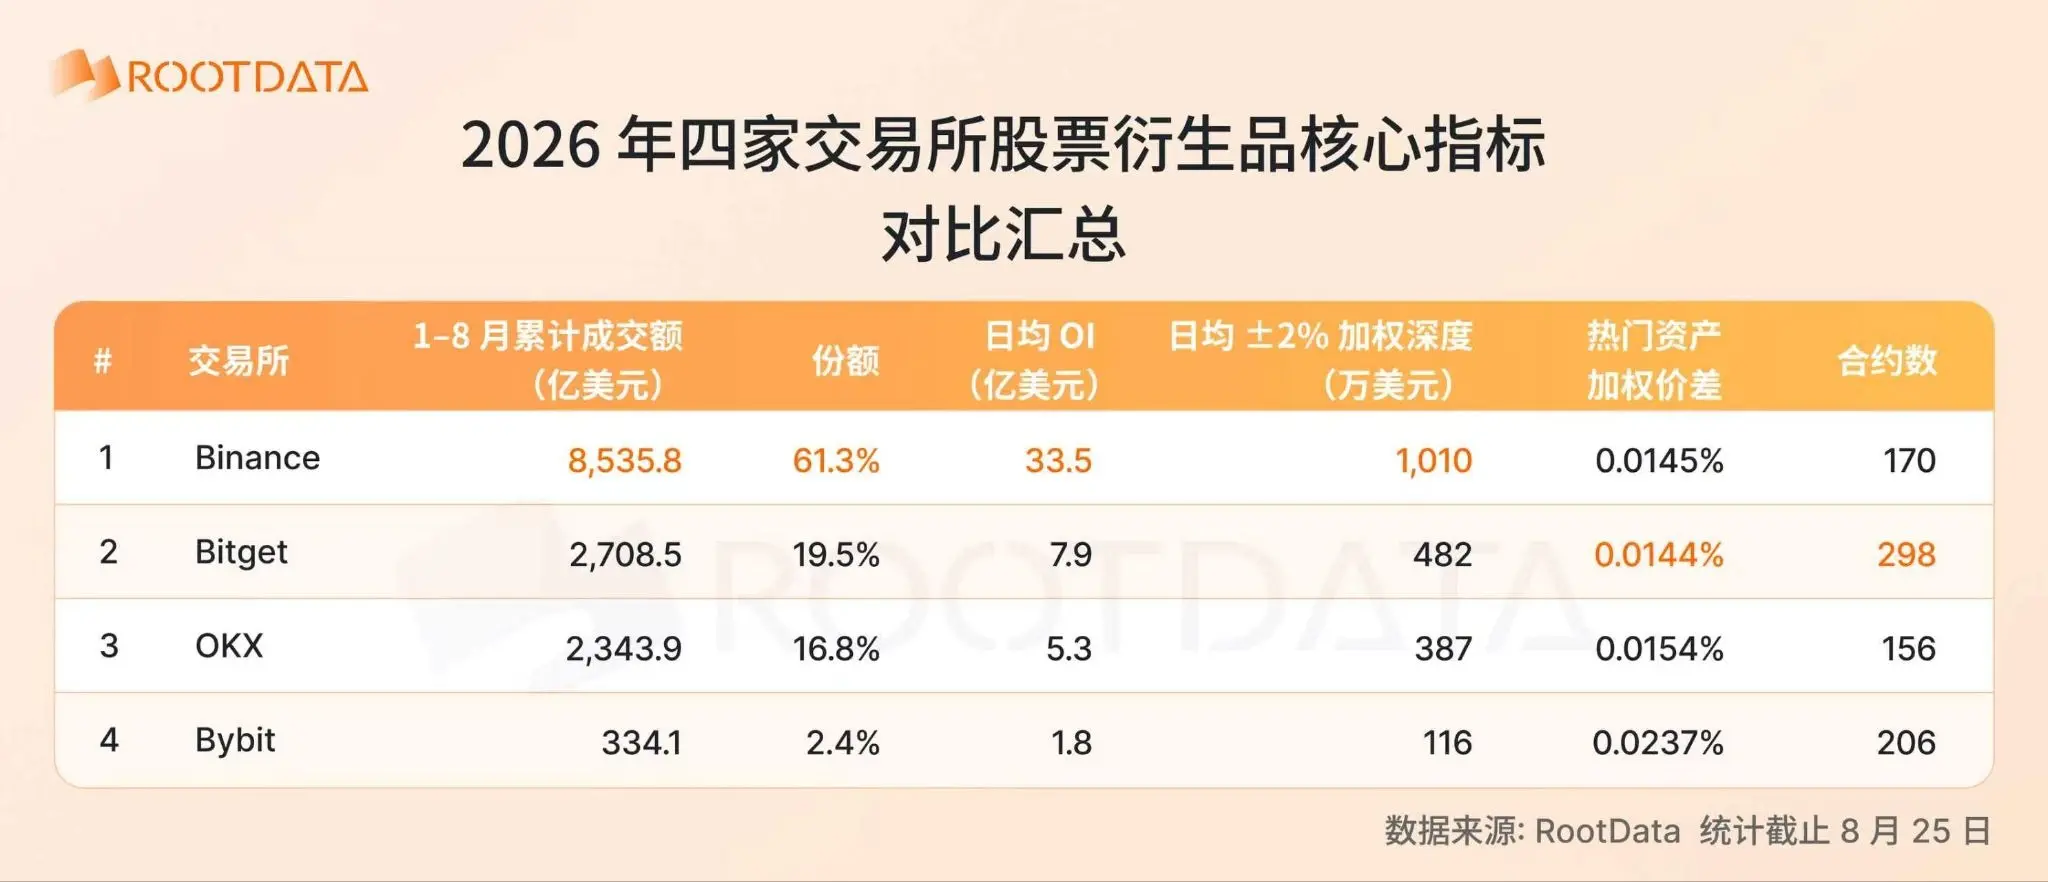
From January to August 2026 (as of August 25), the cumulative transaction amount shows a significant head concentration effect. Among the four exchanges, Binance dominates with $853.58 billion, holding a 61.3% share; Bitget follows with $270.85 billion and a 19.5% share; OKX (with $234.39 billion and 16.8%) comes next; Bybit (with $33.41 billion and 2.4%) is relatively smaller. In terms of trading volume trends over the past two months and cumulatively, competition among mainstream exchanges remains tight, excluding Binance.
2.2 Open Interest (OI): Differentiation in Capital Accumulation Ability
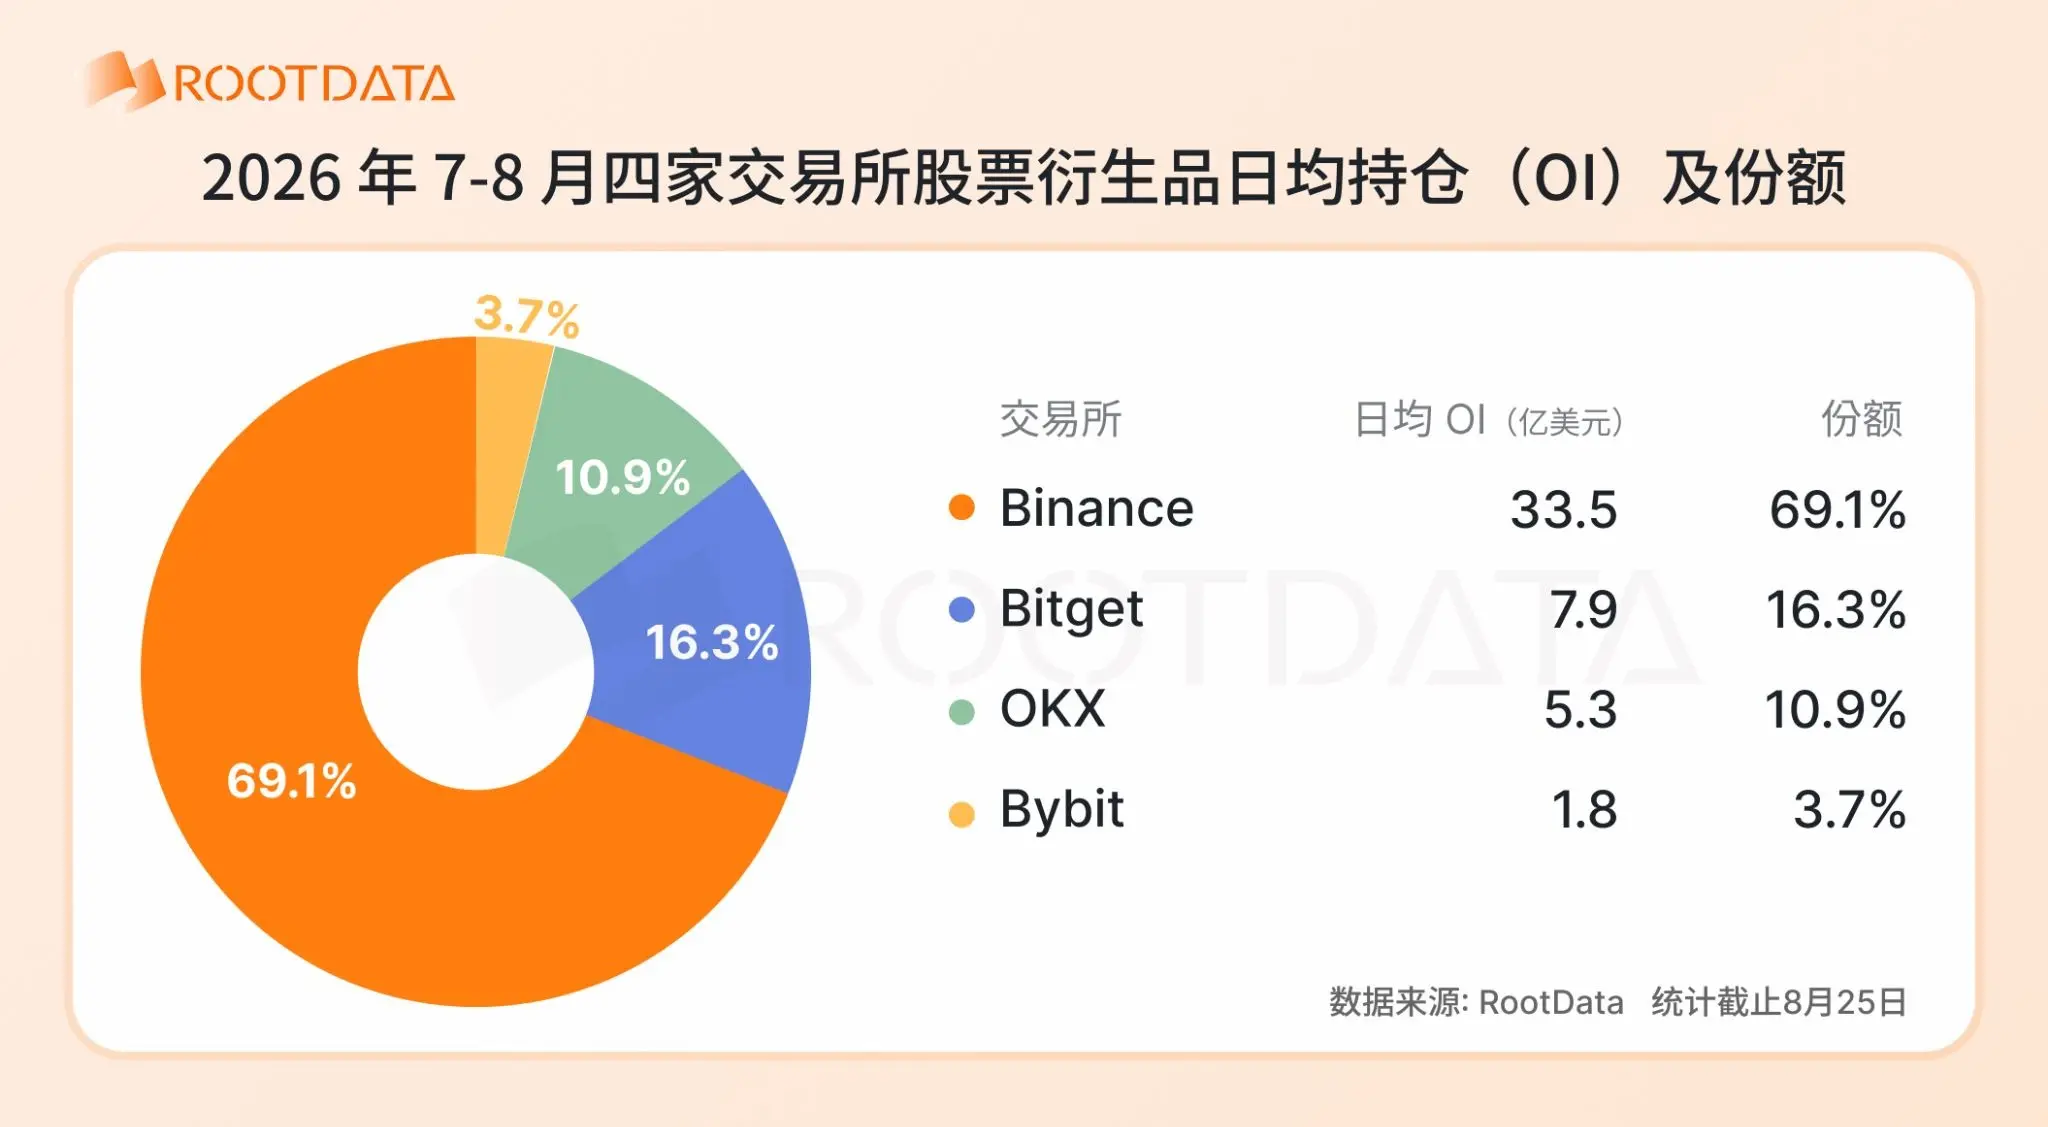
From the average daily open interest (OI) over the past month (July 25 - August 25), Binance leads significantly with $3.35 billion and a 69.1% share; Bitget follows with $790 million and a 16.3% share; OKX ($530 million, 10.9%) and Bybit ($180 million, 3.7%) rank third and fourth, respectively.
2.3 Market Depth: Binance and Bitget Together Account for 70% of Liquidity
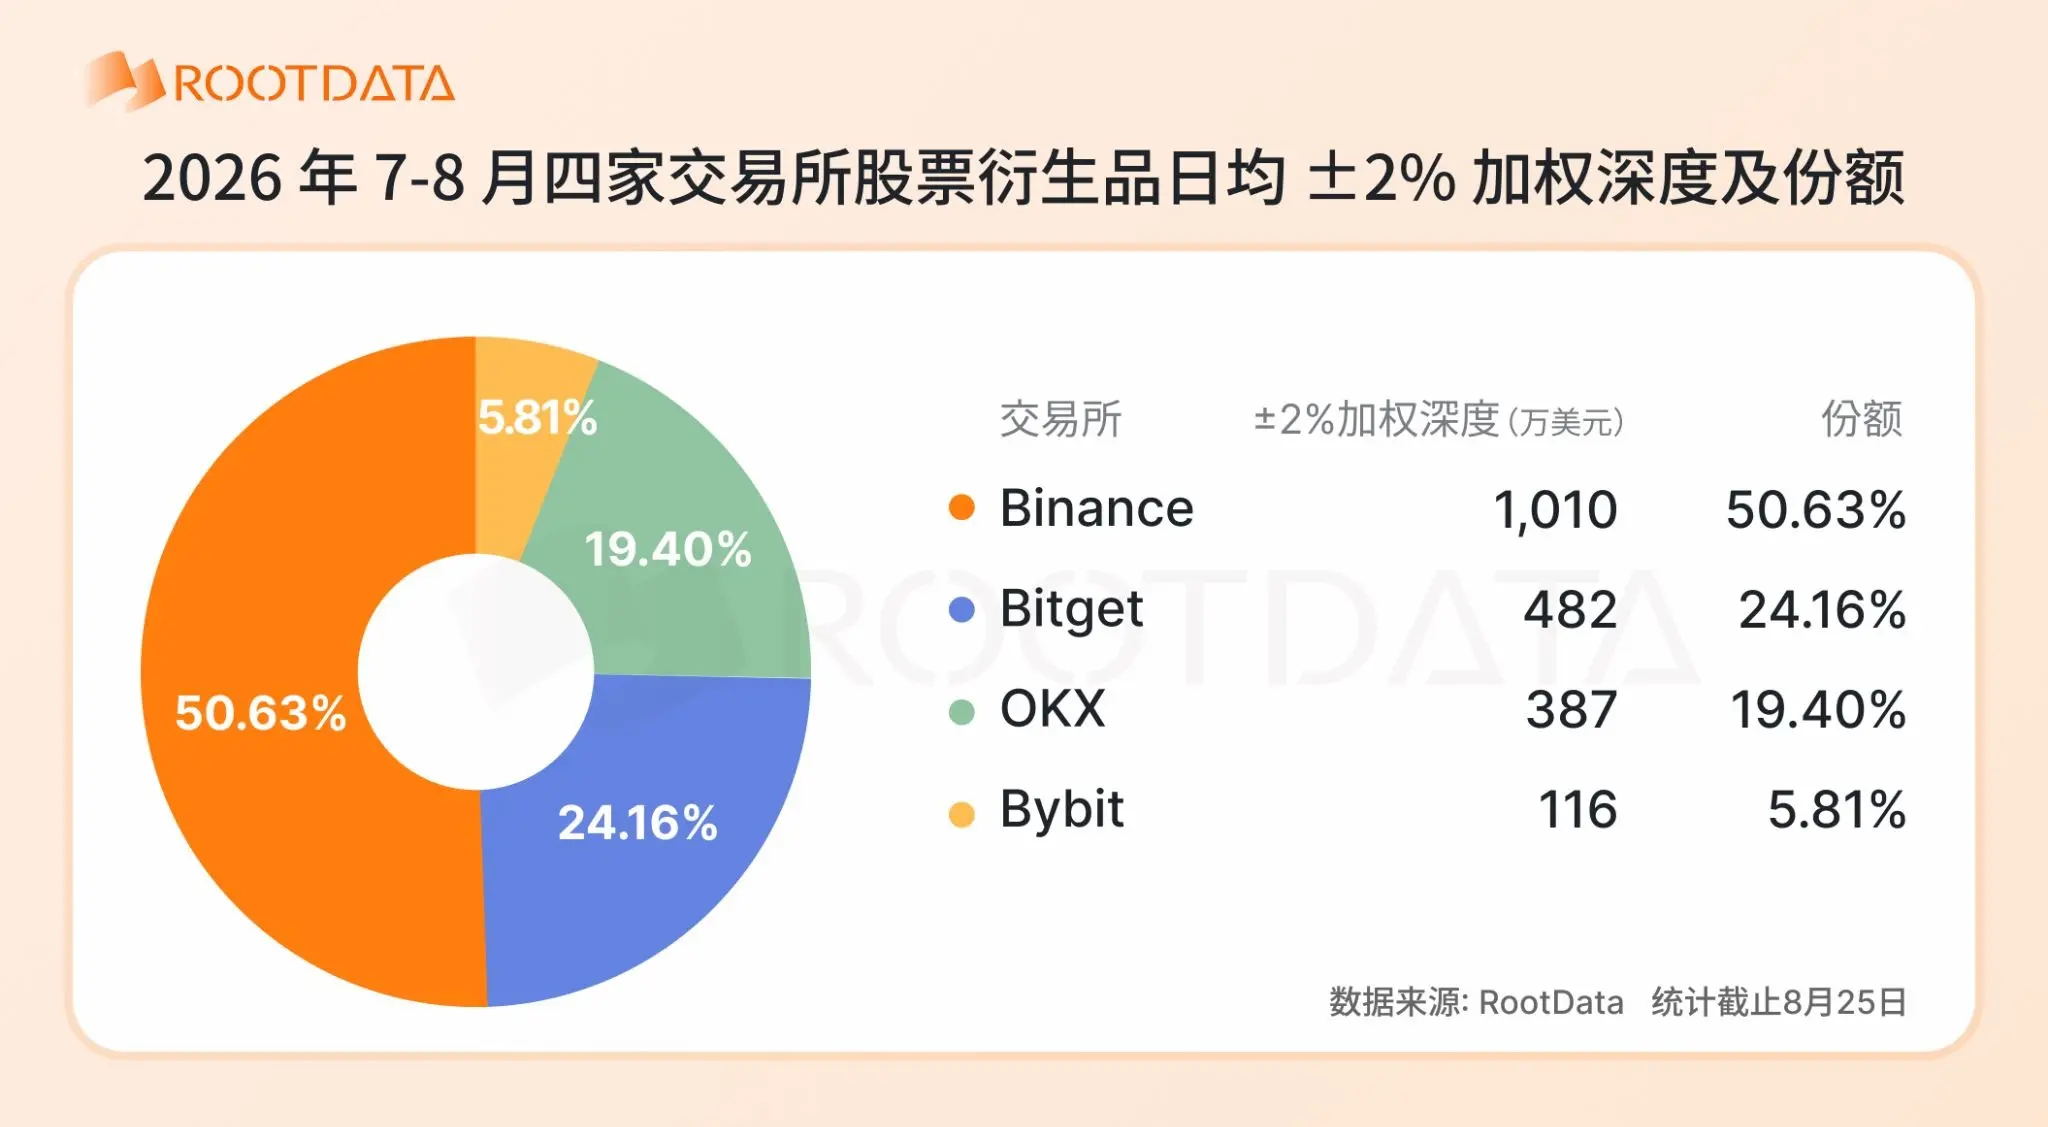
From the ±2% weighted depth perspective, Binance and Bitget together account for 70% of liquidity. Binance maintains the top position with an average daily depth of $10.1 million; Bitget follows closely with $4.82 million, about 48% of Binance's depth; OKX ($3.87 million) and Bybit ($1.16 million) show a significant gap compared to the top two.
The combined depth of Binance and Bitget accounts for over 70% among the four exchanges. Notably, Bitget's depth share (24.2%) exceeds its OI share (16.3%), indicating a strong investment in liquidity provision, with the market thickness supported by unit positions higher than the industry average.
2.4 Trading Costs: Narrowing Price Spread Differences
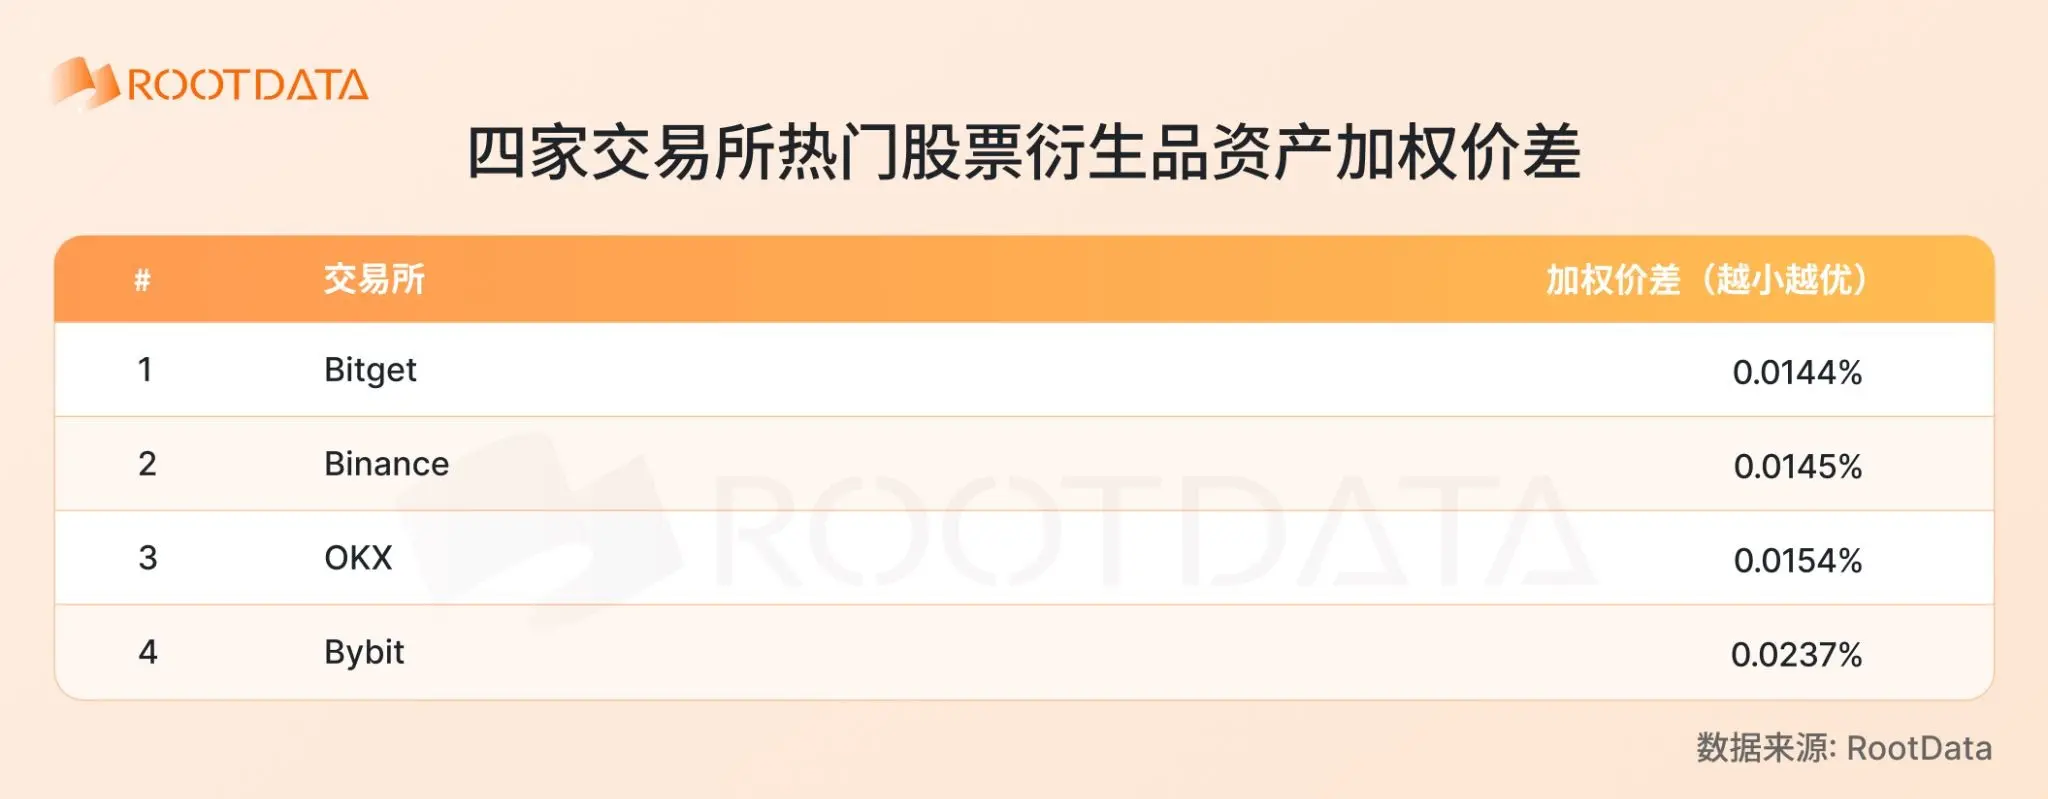
From the weighted price spreads of over a dozen representative popular assets recently tracked, Bitget ranks first with a spread of 0.0144%, offering the best quote quality; Binance (0.0145%) follows closely, with both nearly at the same level; OKX (0.0154%) ranks third, with only a small gap from the top two; Bybit is temporarily lagging at 0.0237%.
The tracked assets cover the most representative popular assets in the market, including tech giants like Apple (AAPL), TSMC (TSM), Arm (ARM), Amazon (AMZN), as well as core broad-based ETFs like QQQ (Nasdaq 100) and SPY (S&P 500), and also includes popular crypto concept assets like MicroStrategy (MSTR) and Circle (CRCL).
Overall, the price spreads of the three leading platforms—Binance, OKX, and Bitget—have compressed to within 0.016%, narrowing the differences in trading costs. Bitget has shown outstanding quote quality on the popular assets tracked, ranking alongside Binance in the top tier; Bybit still has room for optimization with wider spreads on some assets. The differentiation among platforms is more evident in dimensions such as depth, variety, and user experience.
2.5 Asset Strategy Differences Are Obvious
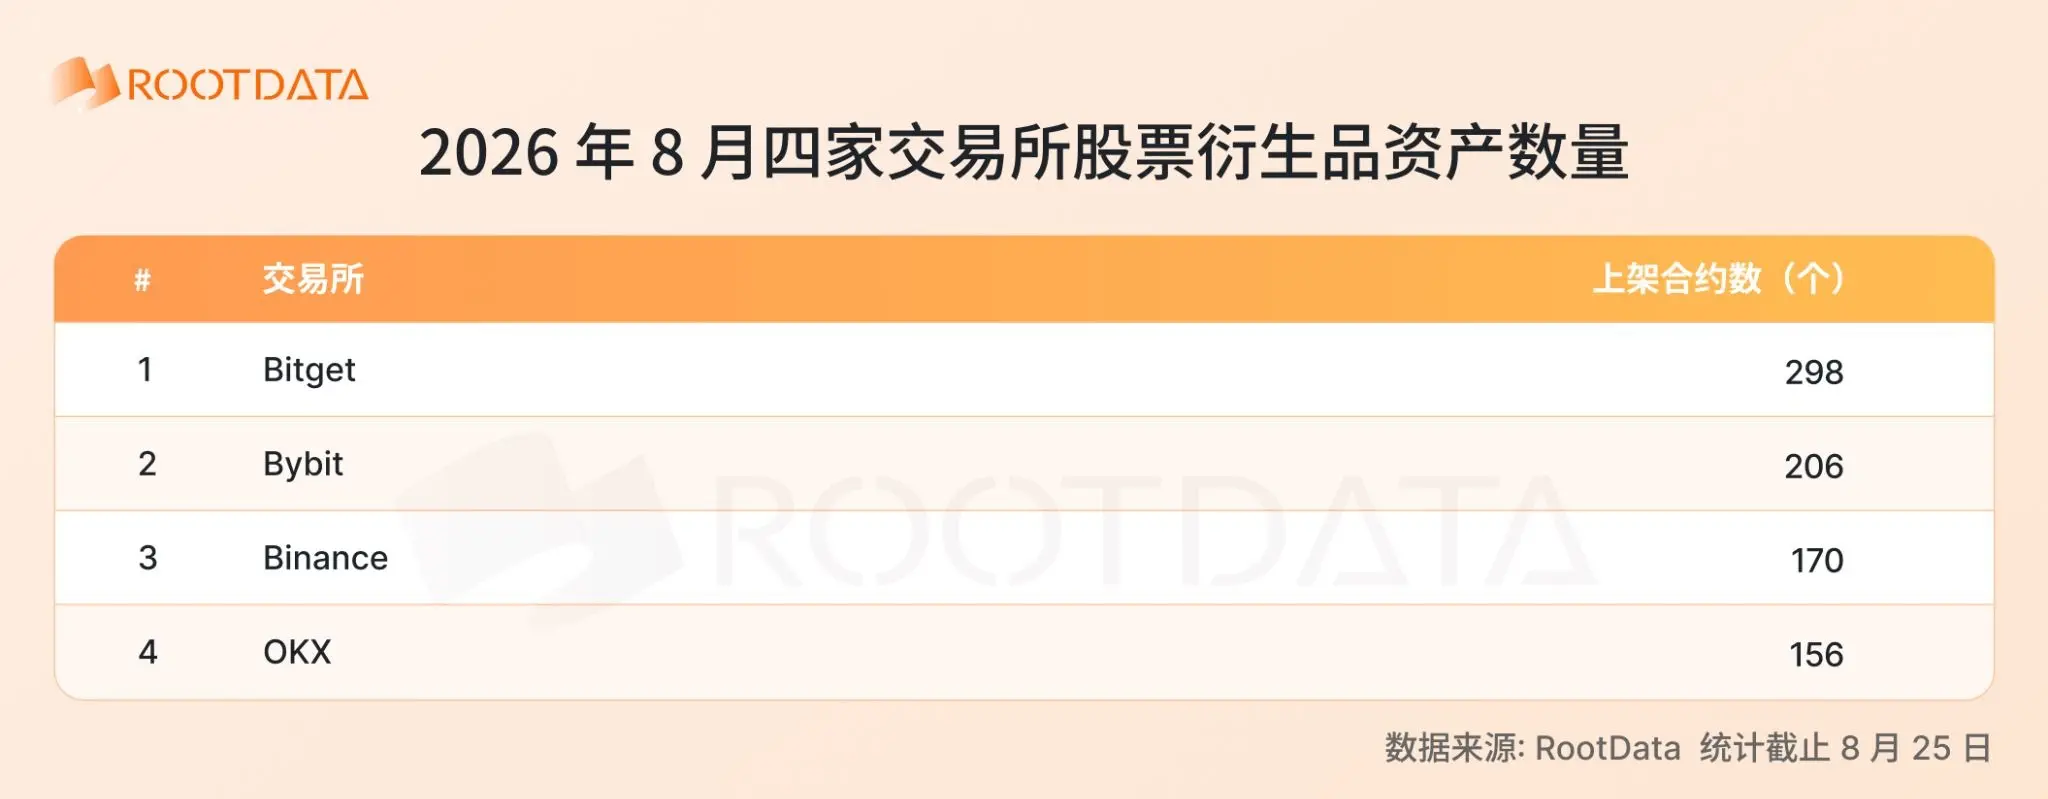
As of August 25, in terms of the number of listed contracts, Bitget ranks first with 298, following a "broad coverage" strategy; Bybit (206) and Binance (170) rank second and third, respectively; OKX has 156. The gap in product coverage among the four platforms is not significant, with Bitget and Bybit focusing more on a "wide and comprehensive" fast-paced listing, while Binance and OKX are relatively restrained.
2.6 Summary of Horizontal Comparison
From multiple dimensions, the current landscape of stock derivatives exchanges shows clear stratification characteristics.
Binance ranks first in transaction volume, average daily OI, and average daily ±2% weighted depth, making it the absolute center of stock derivatives liquidity; however, its contract coverage is not the widest, and it does not have an absolute leading advantage in the weighted price spreads of popular assets.
Bitget is currently the most balanced platform in terms of comprehensive layout, ranking first in weighted price spreads of popular assets, with the widest contract coverage among the four, and ranking second in transaction volume, OI, and depth liquidity indicators, showing no weaknesses in trading costs and liquidity.
OKX ranks third in price spreads of popular assets and the three liquidity indicators, with the thinnest contract coverage among the four, presenting an overall "curated" characteristic.
Bybit ranks second in contract coverage but ranks fourth in trading volume, open interest, depth, and spread. Its layout in the stock derivatives segment is still in the expansion stage.
III. Conclusion
In 2026, the stock derivatives segment has transitioned from "marginal experimentation" to the "explosive growth" phase, with a cumulative trading scale of approximately $17.5 trillion from January to August. The rapid expansion of the market is reshaping the competitive logic of exchanges, where relying solely on traffic or a single-dimensional advantage is no longer sufficient to establish barriers. Competition is shifting from "who has the larger trading volume" to who can achieve a better balance between cost, depth, variety, and capital accumulation.
In the current landscape, Binance remains the absolute center of liquidity, but the differentiation paths of leading platforms have gradually become clear. Bitget, with its optimal performance in the spreads of popular assets and the widest contract coverage, combined with a balanced lead in trading volume, depth, and open interest liquidity indicators, has become the platform with the most comprehensive dimensions and no obvious shortcomings; OKX has taken a differentiated route by selectively focusing on top assets; Bybit is actively following up on asset expansion, but its overall scale still has room to catch up.
Looking ahead to the second half of the year, as the segment enters a quality competition phase under high base conditions, platforms with multi-dimensional comprehensive capabilities are more likely to capture the next round of incremental growth. Exchanges that can maintain pricing and depth advantages on core assets, while also covering long-tail demands with a rich variety of assets, and remain competitive in liquidity will occupy a more favorable position in the transition from "volume growth" to "quality competition."
The ultimate outcome of the stock derivatives segment may not belong to a single champion but to those players who have no obvious shortcomings and can maintain competitiveness across multiple dimensions.
 Risk warning



Popular articles