CICC: Can AI's high prosperity withstand the supply test?
 Core Viewpoint


 CICC Research Report: In the third quarter, the global AI chain experienced a significant correction and digestion of congestion, leading to a divergence in trends. The Taiwan Composite Index and Nasdaq reached new highs at one point, while the Philadelphia Semiconductor Index and ChiNext saw a slowdown in their upward momentum. The report discusses whether the high prosperity of AI can be sustained, which depends critically on the speed of supply expansion and industry concentration.
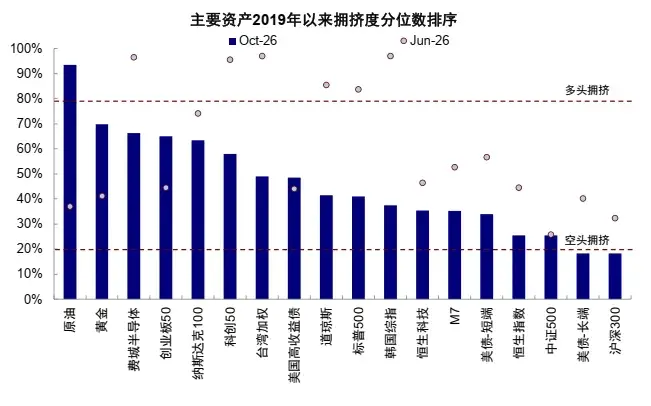
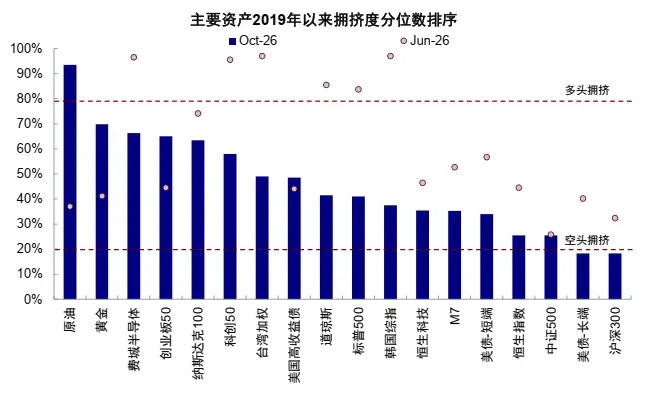
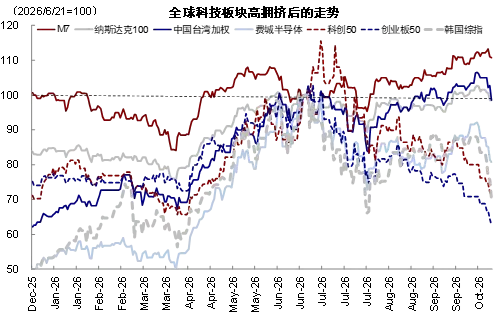
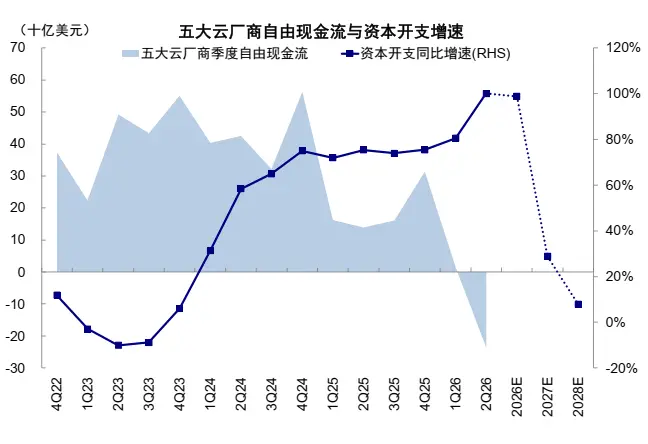
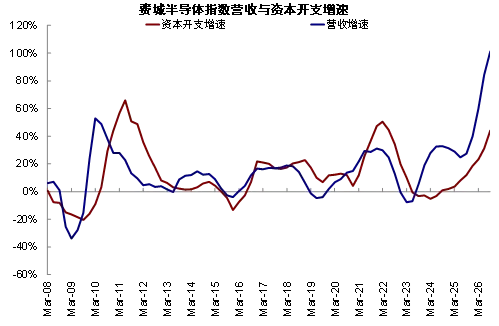
After a significant pullback to digest high congestion in the global AI supply chain in the third quarter (Chart 1), the trend has begun to show clear differentiation. The Taiwan Composite Index and the Nasdaq reached new highs at one point, while the upward slopes of the Philadelphia Semiconductor Index, STAR Market 50, and ChiNext 50 have slowed down, even completely retracing their gains for the year (Chart 2). Behind this, in addition to the impacts of the macro and micro environments within various markets, such as changes in U.S. Treasury yields and the funding situation in the A-shares market, it is likely closely related to the subtle changes in supply and demand relationships at different stages of the AI supply chain: the market is concerned that the capital expenditures of cloud vendors, which represent demand, may have surpassed the fastest growth phase (Chart 3), and new supply from some upstream segments such as optical modules, GPUs, and storage chips is being gradually released (Chart 4).
Chart 1: The tech sector was abnormally congested in June 2026, but has clearly cooled down since then.
Source: Bloomberg, Wind, CICC Research Department
Chart 2: After digesting the congestion, M7 and the Nasdaq reached new highs, but the momentum of the Philadelphia Semiconductor Index and ChiNext 50 has clearly slowed.
Source: Wind, CICC Research Department
Chart 3: The capital expenditures of the five major cloud vendors may have surpassed the fastest growth phase.
Source: Factset, CICC Research Department
Chart 4: The capital expenditures of the semiconductor sector and cloud vendors are increasing and decreasing, respectively.
Source: Factset, CICC Research Department
The contrasting rhythms of supply and demand, with one speeding up and the other slowing down, have led to signs of convergence in the previously widening supply-demand gap. The high prosperity logic driven by simultaneous increases in volume and price is also facing new challenges, directly causing the market to shift from consensus to divergence. So, how long can this round of AI-driven high prosperity last? This is likely the most concerning question for global investors at present.
1. Three cognitive biases in judging high prosperity: Demand is important, but supply also deserves attention
High prosperity, as the name suggests, means that demand is in an upward channel, and thus supply is often intentionally or unintentionally overlooked. However, compared to demand, supply also deserves attention, and we believe there are three cognitive biases worth re-examining.
► First, while demand is indeed important, supply also deserves attention; investors often emphasize and amplify first-order demand while easily neglecting and underestimating second-order supply. Investors tend to derive future revenue growth and capital returns from market space, penetration rates, customer stickiness, and technological iterations, but they often overlook the supply response induced by growth itself. Demand growth does not naturally equate to investment returns; on the contrary, the more certain and attractive the growth prospects, the more likely it is to attract capital, drive companies to expand production, and intensify competition. When new supply outpaces demand, what was originally scarce may turn into surplus, leading to a decline in prices and profit margins; conversely, if supply is constrained by capacity, technology, or supply chain bottlenecks, even if demand growth does not accelerate further, prices and profits may still achieve nonlinear growth. Therefore, demand opens up growth space, while supply amplifies return elasticity.
► Second, predicting demand relies on a large number of uncertain long-term assumptions, while judging supply has more certain reference indicators. During periods of technological iteration, terminal demand, application landing rhythms, and customer willingness to pay all have high uncertainty, and forecasts of long-term market space often rely on numerous assumptions. In contrast, supply indicators such as capital expenditures, construction capacity, financing scale, and competitor entry are usually more observable and verifiable. Especially in the current AI industry, compared to predicting application scales and commercialization prospects years down the line, identifying supply expansions that have already occurred or are brewing often has a more solid data foundation. Rather than seeking certainty in highly uncertain long-term demand, it is better to grasp marginal changes in capital returns from relatively observable supply changes.
► Third, even when recognizing the importance of supply, it is easy to equate supply expansion with declining returns. While supply expansion may indeed disrupt the original balance, increasing production does not necessarily lead to surplus, and high investment does not necessarily mean low returns; the key lies in the competitive landscape of the industry: in a market with dispersed competition, rational production expansion decisions by individual companies may accumulate into irrational investments at the industry level; whereas in a market with higher concentration, companies are often better able to consider the impact of their production expansion on industry supply and prices, and new investments may more reflect technological upgrades, efficiency improvements, or expansion of leading market shares, rather than disorderly competition. Therefore, what is truly worth being cautious about is not the supply expansion itself, but the expansion that lacks supply discipline; what determines returns is not only the scale of supply expansion but also the competitive landscape in which the supply expansion occurs.
Based on the above considerations, this article will not repeat the extensively discussed AI demand prospects and market space, but will turn to the often-overlooked supply side, re-examining the formation mechanism and sustainability of the current high prosperity from this perspective to provide investors with a basis for judgment.
In this article, 1) we first identify the prosperity direction of major markets such as the U.S., China, and South Korea, judging how strong this round of growth is; 2) next, we explain the formation mechanism of strong growth from the perspective of supply and demand; 3) then, we assess the intensity of supply expansion from the dimensions of investment intensity and new financing; 4) furthermore, we introduce the competitive landscape, analyzing the economic consequences of supply expansion under different competitive structures through historical data and empirical testing; 5) finally, we apply this framework to the current situation, judging which industries' high growth is difficult to sustain and which industries still have room for improvement in returns.
2. How to identify the direction of high prosperity? U.S. electrical equipment and semiconductors, A-share electronics, etc.
To determine whether this round of high prosperity can withstand the test of supply expansion, we first need to define prosperity and identify how strong the current prosperity level is.
How to define prosperity? A low base can create high growth, but it does not necessarily mean significant operational improvement; similarly, a 20% profit growth may represent a significant change for stable consumer companies, but for cyclical companies, it may just be normal fluctuations. Looking solely at year-on-year numbers, it is easy to mistake base effects for growth or prosperity. On the other hand, the profit fluctuations of different industries also show significant differences; even high growth after excluding base effects does not necessarily mean that the industry has entered a prosperous phase.
To this end, this article introduces Standardized Unexpected Earnings (SUE), which measures the degree to which current profit growth deviates from historical norms by taking the difference between the current profit growth rate and the historical mean, divided by the standard deviation of historical profit growth rates:
SUEᵢ,ₜ=[ΔEᵢ,ₜ-mean(ΔEᵢ)]/std(ΔEᵢ,ₜ₋ₖ),
where ΔE is the year-on-year growth rate of quarterly profits. This helps reduce the interference of base differences and increases the comparability of profit growth across different industries. The higher the SUE, the stronger the current profit growth relative to historical norms; SUE greater than 0 indicates that profit growth exceeds the historical mean; SUE greater than 1 indicates that profit growth exceeds the historical mean plus one standard deviation, reflecting strong profit prosperity. This article defines industries with SUE greater than 1 as high prosperity industries.
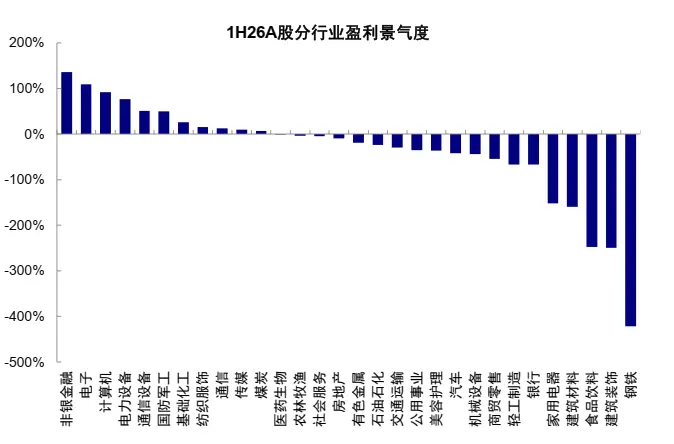
Our calculations show that the current high prosperity industries mostly belong to the AI supply chain, such as electrical equipment, semiconductors and equipment, electronics, and software in the U.S. stock market (Chart 5), as well as electronics and other sectors in the A-share market (Chart 6). Additionally, non-bank financials in the A-share market also exhibit high prosperity.
Chart 5: In the first half of 2026, the profitability of electrical equipment, semiconductors, and other industries in the U.S. stock market is relatively high.
Source: Factset, CICC Research Department
Chart 6: In the first half of 2026, the profitability of electronics, computers, electrical equipment, and other industries in the A-share market is relatively high.
Source: Wind, CICC Research Department
3. What are the reasons for the upward trend in prosperity? Demand opens up growth space, supply amplifies return elasticity
The upward trend in prosperity is due to the opening up of demand prospects and the amplification of return elasticity by supply constraints. Taking this round of AI as an example,
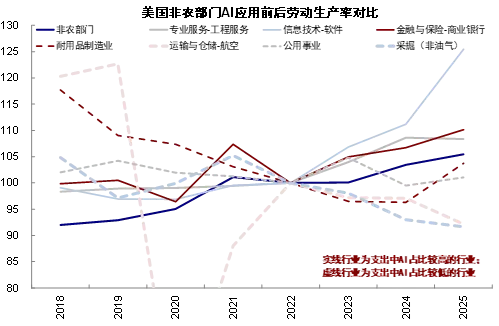
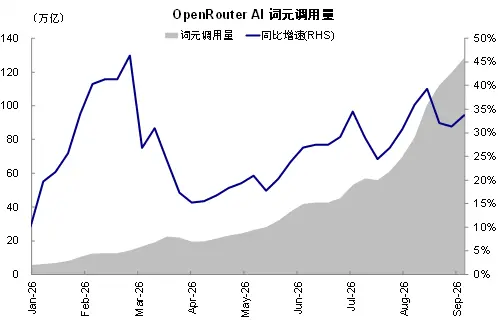
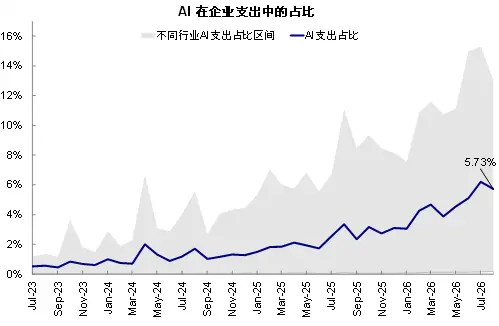
► On one hand, the core driving factor behind the expansion of AI demand comes from the significant improvement in labor productivity brought about by the continuous iteration of large model capabilities. According to estimates by Anthropic, AI assistance can reduce the average completion time of certain tasks by 80%, and the application scenarios for large models are becoming increasingly rich. The overall labor productivity in the U.S. non-farm sector has significantly improved, particularly in industries with high AI input such as information technology and financial insurance (Chart 7). The improvement in production efficiency drives a continuous high-speed growth in token usage (Chart 8), and cloud vendors are continuously increasing their computing power investments, leading to rapid expansion in demand for AI computing power and related infrastructure. From a longer-term perspective, the current proportion of AI in corporate spending and the absolute amount of personal payments are still at relatively low levels (Chart 9), indicating that AI may still be in the early stages of application. Whether it is model training, inference, or the future landing of more applications, there is significant potential market space. The rapid growth of AI demand determines the expansion space of the related supply chain.
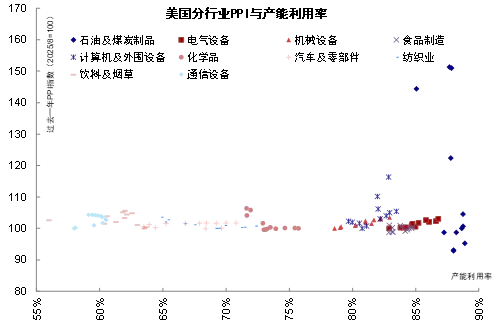
► On the other hand, supply constraints further amplify the profit elasticity brought about by demand growth. When there is a significant amount of idle capacity in the industry, new demand can mainly be met by increasing output, and price responses are usually mild; as capacity utilization gradually approaches its limit, the short-term space for companies to increase production narrows, and it becomes increasingly difficult to digest new demand through quantity expansion, leading to more price increases. At this point, the supply curve gradually becomes steeper, and the same magnitude of demand growth corresponds to a larger price change. The industry gradually shifts from a relatively linear "volume increase" to a "simultaneous increase in volume and price." The nonlinear increase in prices further amplifies profit elasticity. Increasing production usually requires additional investments in raw materials, labor, etc., and new income must deduct corresponding costs to form profits; under the condition of unchanged sales volume and unit costs, the revenue increment brought about by price increases directly translates into profits. Therefore, for the same scale of revenue growth, the profit increment from price increases is usually higher than that from sales growth, and the lower the original profit margin, the more pronounced this amplification effect becomes.
Chart 7: Labor productivity in the U.S. non-farm sector has improved, with more significant improvements in industries with higher AI input.
Source: Fred, CICC Research Department
Chart 8: The volume of AI token usage continues to grow rapidly.
Source: OpenRouter, CICC Research Department
Chart 9: The proportion of AI spending in corporate investment (excluding salaries) rises from 0.5% in 2023 to 5.7% in 2026
Source: Ramp, CICC Research Department
This mechanism is particularly prominent in the bottleneck segments of the industrial chain. In a production system where various segments are interlinked and difficult to replace in the short term, overall output is constrained by the segment with the most limited supply (the "barrel theory" or Leontief production function). Even if other segments have sufficient capacity, a shortage of key components will still limit downstream production, concentrating new demand on the bottleneck segment, driving up its prices and profits. This is the bottleneck effect revealed by the Leontief-style complementary production relationships mentioned in our previous report "Speculations on the AI Era and Demographic Changes": the ability to expand the industrial chain is not simply the sum of the capacities of each segment, but rather whether the key segments can provide sufficient supporting supply.
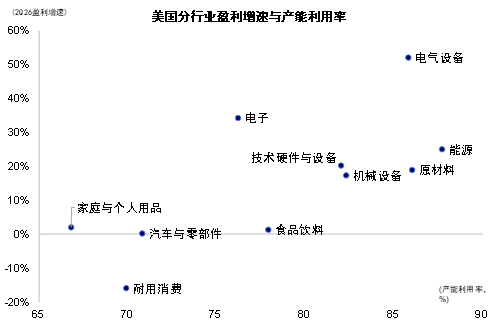
Therefore, the current strong upward trend in the AI industry actually encompasses two layers of forces: demand expansion provides the basis for profit growth, while supply constraints further amplify price and profit elasticity. Strong AI demand first drives sales expansion, and when demand further touches supply constraints, prices and profit margins begin to rise in tandem, causing profit growth to outpace revenue growth, leading to significantly higher-than-normal standardized unexpected earnings (SUE) in certain industries. Our calculations show that industries with high SUE in the U.S. stock market, such as electronics and electrical equipment, also exhibit high capacity utilization rates and significant product price increases (Chart 10, Chart 11). The exceptionally strong profit performance in these industries is not solely due to high demand growth, but rather the result of strong demand and tight supply working together.
Chart 10: Industries with high capacity utilization are also those with faster profit growth
Source: Factset, BEA, CICC Research Department
Chart 11: Significant non-linear price increases are likely to occur under high capacity utilization
Source: Haver, CICC Research Department
IV. How to Identify the Intensity of Supply Expansion? The sustainability of high prosperity depends on how quickly supply expansion responds
When demand growth reaches capacity constraints, non-linear price increases will amplify profit elasticity and capital returns. However, whether this high prosperity can be sustained depends on the impact of supply expansion triggered by high returns on capacity constraints.
So how do we identify and assess the intensity of supply expansion? Referring to the research ideas of Hoberg and Phillips (2010), we characterize the intensity of supply expansion from two dimensions: relative investment intensity and new financing: 1) First, we introduce relative investment intensity to find a reasonable reference frame for current supply expansion and assess whether actual capacity expansion has deviated from normal levels; 2) Secondly, we examine future investments that have not yet occurred to determine whether companies have obtained the necessary new financing to continue expanding capacity.
1) Has current investment deviated from normal? Determine the "reasonable investment level"
An increase in capital expenditure in high-prosperity industries does not necessarily mean increased supply pressure. Improved demand prospects, rising profitability, and relaxed financing conditions can make higher investment a rational choice. Therefore, the key to assessing supply pressure is not the absolute level of capital expenditure, but rather the degree to which actual investment deviates from the implied "reasonable investment level" based on operating conditions. This article references the method of Hoberg and Phillips (2010) to estimate the normal investment intensity of companies under given operating conditions using factors such as Tobin's Q, ROE, leverage ratio, profit volatility, dividends, company age, and size, establishing a benchmark for investment intensity. We then define relative investment intensity (RI) as the difference between actual investment intensity and the model's predicted value, specifically:
► Investment prospects are measured using Tobin's Q, which positively drives investment intensity. The theoretical implication is the ratio of the market value of capital to its replacement cost; when the market value exceeds the replacement cost and new capital can achieve similar returns, companies are motivated to expand capacity. Thus, the Q value can indirectly reflect the market's judgment on investment prospects. In calculations, Tobin's Q uses the lagged value to avoid introducing unknown information;
► Funding conditions are represented by ROE and leverage ratio, which have opposite effects on investment intensity. Investment depends not only on whether the project is worth investing in but also on whether the company has the corresponding financial expenditure and leverage space. ROE depicts the company's profitability, positively driving investment intensity. Leverage, on the one hand, limits the company's financing space, while on the other hand, it has a debt overhang effect; when a company already has a heavy debt burden, part of the new project's returns may first flow to creditors, thereby weakening shareholders' motivation for additional investment;
► Profit volatility depicts investment uncertainty. Theoretically, when faced with projects with similar investment returns, greater profit volatility implies greater uncertainty, and since investments in factories, equipment, etc., are difficult to retract, rational companies may choose to wait to gather more information before making decisions. Empirical evidence shows that the relationship between this indicator and investment intensity is unclear;
► Capital renewal demand is proxied by dividends, company age, and size, which are often negatively correlated with investment intensity. Companies that pay dividends are usually in the mid to late stages of the industry lifecycle and have insufficient willingness for large-scale capital expenditure. There are significant differences in capital renewal replacement demand among companies of different ages and sizes; older and larger companies may have weaker capital expenditure intensity.
The "reasonable investment intensity" also partially reflects information from the demand side. Although the model does not directly use variables such as orders or revenue growth rates from the demand side, variables like Tobin's Q and ROE partially reflect changes in demand prospects and revenue growth rates. However, some information, such as the latest orders or unfulfilled technological opportunities, still needs further validation.
We have fitted various industrial chain segments including oil and gas (U.S.), building materials (U.S.), non-ferrous metals (U.S.), semiconductor equipment (U.S., China), digital chip design (U.S., China), semiconductor foundry (global), storage (global), optical modules (U.S., China), PCB (U.S., China), grid equipment (China), and power distribution (U.S.). Except for China's digital chip design, optical modules, and grid equipment, the R² values are all above 0.4, indicating the feasibility and explanatory power of the model, while the lower explanatory power in certain sectors may be related to the short development time and rapid technological iteration in the aforementioned industries.
Our calculations show (Chart 12) that in 2026, industries with high relative investment intensity (RI) include global semiconductor storage, global semiconductor foundry, U.S. building materials, U.S. PCB, and U.S. optical modules, all of which have investment intensity significantly above the "reasonable level." It should be noted that high RI cannot directly serve as a basis for excessive investment and more aggressive capacity expansion; it may also stem from new orders, new technologies, and industrial upgrades that the model has not yet captured, and further judgments should be made in conjunction with information on competitive dynamics.
Chart 12: Historical Trends of Relative Investment Intensity (RI) in Prosperous Sectors
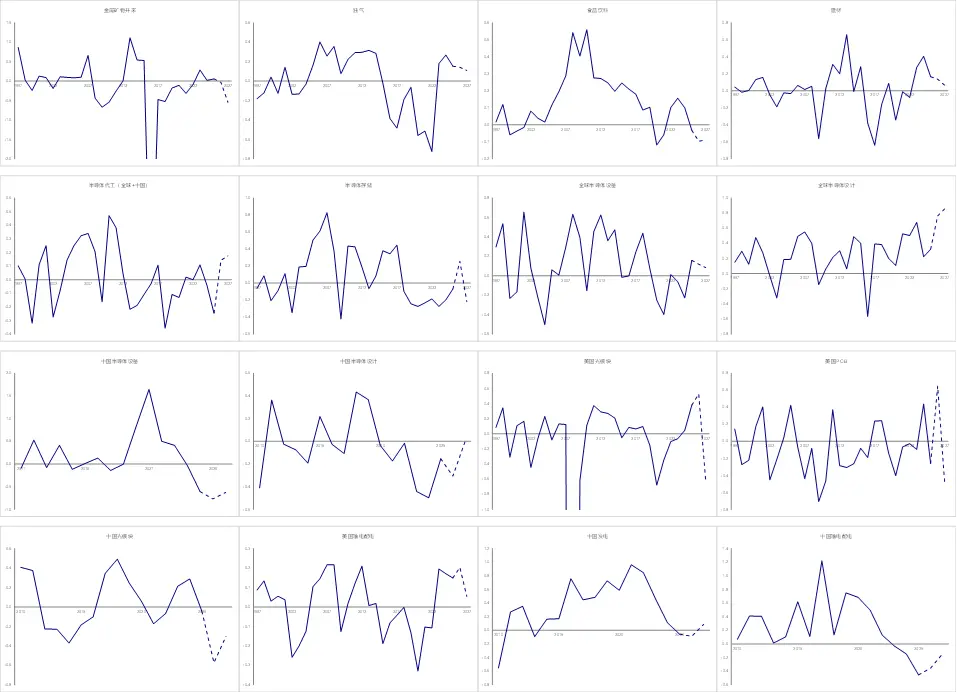
Source: Factset, Wind, CICC Research Department Note: Data from 1997 to 2025 is selected as the statistical sample.
2) How large will future investments be? Observe new financing
New financing is used to observe the probability of future capacity expansion. Relative investment intensity answers the question of "how much current investment deviates from reasonable levels," but what truly determines future supply is whether there is the capacity to continue increasing investment in the next phase. Therefore, we further introduce new financing (New Financing) to observe whether capital is still flowing into the industry.
We define new financing as the sum of net equity financing and net debt financing as a proportion of total assets. Financing is not equivalent to future capital expenditure, but it provides the necessary funding conditions for subsequent capacity expansion. An increase in new financing means that companies have obtained more external funds, creating further conditions for capacity expansion. If RI is already high, and companies continue to receive substantial external financing, it indicates that the industry has not only undergone strong capacity expansion but is also forming conditions for further increasing investment, necessitating caution regarding whether capital is supporting a new round of supply expansion; conversely, if RI is high but new financing has significantly declined, current high investment may not continue to accelerate.
Our calculations show that in 2026, new financing intensity across industries is relatively restrained, with only global semiconductor foundry and U.S. semiconductor equipment exceeding the 50th percentile, both at the historical 68th percentile; financing intensity in U.S. optical modules, U.S. building materials, global semiconductor storage, and global digital chips is at relatively low percentiles. Therefore, overall, the only industry with both high investment intensity and high financing intensity is global semiconductor foundry.
V. Does Supply Expansion Always Reduce Returns? It Also Depends on the Competitive Landscape
High-intensity supply expansion may disrupt the original supply-demand balance, leading to increased supply pressure; it may also meet the demands of rapid growth or technological upgrades. Therefore, high investment does not necessarily mean low returns; the key lies in the industry's competitive landscape.
1) The Economic Implications of Supply Expansion Under Different Competitive Landscapes
When an industry is relatively fragmented, the rationality of individual companies may translate into irrationality at the industry level. Each company may see price increases and high profits and wish to expand their share. However, when one company increases capacity, it affects the future prices and returns of other companies. If everyone invests based on the current scarcity but underestimates the scale of competitors' simultaneous capacity expansions, what seems like a rational decision for an individual company may accumulate into an oversupply for the entire industry. Therefore, in industries with medium to low concentration, high relative investment may signal declining performance.
In industries with high concentration, high investment intensity may enhance companies' monopoly profits. In markets with high industry concentration, companies are more likely to recognize the impact of their capacity expansions on industry supply and prices, and investment decisions are more likely to consider this impact, making irrational investments easier to correct. Thus, high relative investment and new financing in high-concentration industries may indicate changes in historical relationships under shocks such as technological upgrades and demand surges, where high relative investment may signal improving performance.
In this regard, this article further introduces the industry revenue concentration (HHI) to depict the competitive landscape and potential supply discipline. This indicator is the sum of the squares of the revenue shares of the constituent companies within the industry. The higher the HHI, the more revenue is concentrated among a few leading companies, and supply decisions are relatively centralized; the lower the HHI, the more dispersed the industry participants are, making it easier for multiple companies to simultaneously expand capacity during an upturn, thereby increasing the risk of concentrated supply release.
Our calculations show that industries such as non-ferrous metals in the U.S. stock market, global semiconductor storage, global semiconductor foundry, and U.S. building materials have high revenue concentration, while industries such as China's digital chip design, U.S. oil and gas, and China's semiconductor equipment are relatively dispersed (Chart 13). Of course, actual results are limited by data availability.
Chart 13: Competitive Landscape of Prosperous Sectors
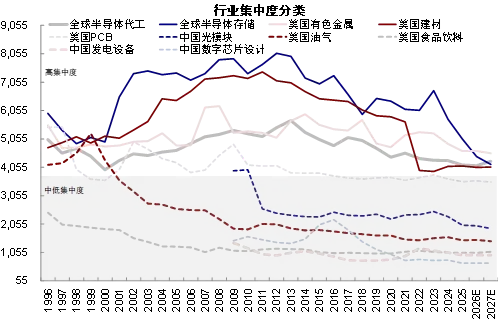
Source: Factset, CICC Research Department
2) Empirical Testing: Expansion under High Concentration Means High Returns and High Prosperity
Next, we further empirically test the effects of relative investment intensity, new financing, and competitive landscape on capital returns. To reduce the impact of statistical errors in HHI, we classify HHI greater than or equal to 4000 as a high concentration group, while the rest are classified as a medium-low concentration group. We also include the lagged change in ROE as a control variable to examine the relationship between current relative investment intensity and financing intensity with the next period's change in ROE. The results show:
► Whether investment can be converted into sustained returns is significantly related to the competitive landscape. In the medium-low concentration group, relative investment intensity has a negative relationship with the next period's change in ROE; in the high concentration group, this relationship turns positive, and both are statistically significant. This means that the further investment deviates from normal levels, the more the returns in a dispersed competitive industry decline, while high concentration industries instead see an improvement in returns.
► Financing intensity is also positively correlated with the next period's change in ROE, but it is not statistically significant, which is insufficient to confirm a stable predictive effect. A possible reason is that financing intensity includes both equity and debt financing, and theoretically, its impact on capital returns may be dual: there are new projects with leverage, buybacks, or high ROIC that enhance investment returns, as well as financial costs and equity dilution that erode capital returns, requiring further disaggregation for testing.
Prosperity and return changes are not completely synchronized; even after new supply is released, industry profits may continue to grow, but their growth rate may gradually revert from an abnormally high level to historical norms, reflected in a decline in SUE, while ROE may not necessarily fall simultaneously. Therefore, this paper further distinguishes the impact of supply on capital return ROE and profit prosperity SUE, adding SUE as a dependent variable to examine whether relative investment intensity and new financing change future profit prosperity. The results show:
► Relative investment intensity can have completely opposite effects on prosperity depending on the competitive landscape. In the medium-low concentration group, relative investment intensity has a negative relationship with the next period's change in SUE; in the high concentration group, this relationship is positive, consistent with the direction of ROE regression, indicating that in dispersed competitive industries, the further investment deviates from normal levels, the more likely profit prosperity will revert from an abnormally high level; while in higher concentration industries, high investment supports profit prosperity.
► Financing intensity is significantly positively correlated with SUE in the medium-low concentration group, while it remains insignificant in the high concentration group. The positive correlation between financing intensity and prosperity in the medium-low concentration group seems to contradict the logic mentioned above that supply expansion weakens prosperity, but it likely reflects two issues: first, companies in industries with a dispersed competitive landscape often face strong financing constraints. The endogenous cash generation ability of companies is relatively weak, and R&D, sales, and capacity construction rely more on external equity and bond financing. Only when prosperity is higher is it easier to obtain external financing. At the same time, there is a time lag from financing to capacity release, and its erosion on capital returns and prosperity may not immediately manifest in the next period. In high concentration industries, the insignificant impact of financing intensity on future SUE may relate to weaker financing constraints faced by companies. In these industries, leading companies have strong internal cash generation capabilities and low reliance on external financing, not needing to wait until obtaining external financing to increase R&D or capital expansion. Therefore, new financing intensity may not be a purely positive signal for prosperity improvement.
In summary, for industries with a dispersed competitive landscape and high investment and financing, caution should be exercised regarding the risk of high prosperity and return retraction; in high concentration industries, high investment may lead to higher returns and prosperity.
Chart 14: Core Supply-Side Variables Affecting ROE
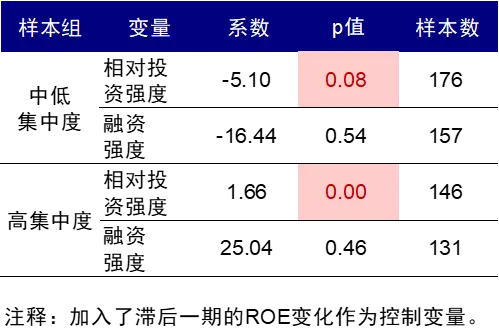
Source: Wind, CICC Research Department
Note: Data from 1997 to 2025 is selected as the statistical sample.
3) Historical Experience: Supply Expansion and Capital Returns during the Internet Bubble
The experience of the Internet bubble also provides an intuitive case for "the implications of investment expansion changing with the competitive landscape." In the late 1990s, the tech boom rapidly rose, and capital expenditures significantly increased. However, under the same investment intensity, different industries had drastically different outcomes, with the competitive landscape playing a key role (Chart 15).
► In industries with dispersed competition, high investment often accompanies a significant decline in capital returns, such as in the semiconductor equipment sector. The RI of the U.S. semiconductor equipment industry reached 0.535 in 1998, at the historical 89.7th percentile; subsequently, by 2001, ROE had cumulatively declined by 28.0 percentage points. The U.S. PCB industry exhibited similar characteristics: the RI reached 0.324 in 2000, also at the historical 89.7th percentile, and one year later, ROE fell by 63.2 percentage points. Both industries had low concentration, and when competitors simultaneously increased supply, reasonable investments at the company level were more likely to accumulate into supply pressure at the industry level.
► High concentration industries showed different results, such as semiconductor foundries. The global semiconductor foundry industry had an HHI of 4289 in 2001, classifying it as a high concentration industry; that year, the RI was 0.250, also at a high historical 82.8th percentile, but one year later, ROE increased by 7.5 percentage points. In other words, in industries where supply decisions are more concentrated, investments significantly above historical normal levels do not necessarily evolve into chaotic expansions and oversupply.
Chart 15: Divergence in ROE Trends between High Concentration Semiconductor Foundry Industry and Other High Investment Intensity Industries during the Internet Bubble
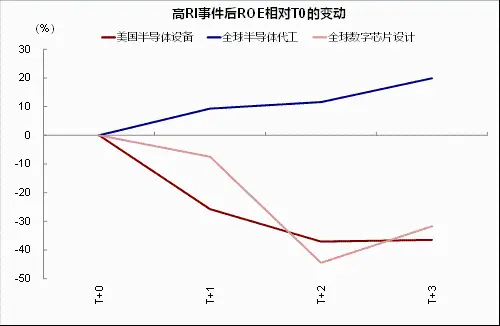
Source: Factset, CICC Research Department
VI. Which Industries Can Sustain High Prosperity in the Future? Supply Favors China's Semiconductor Equipment and Power Grid Equipment, Global Digital Chips May Face Pressure
The analysis above tells us that supply intensity has good explanatory power and a leading one-year predictive effect on capital returns and prosperity, with the direction depending on the industry's competitive landscape, and the independent predictive effect of new financing is limited. Therefore, in assessing future prospects, we first identify the competitive landscape, then use relative investment intensity as the main signal to judge the direction of return changes.
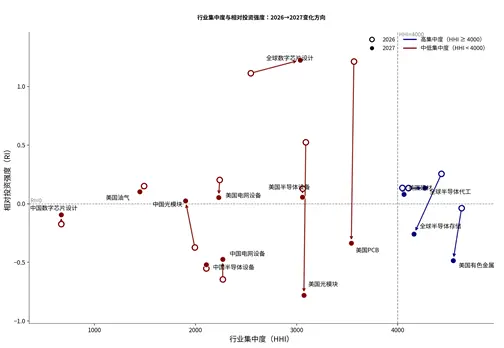
► Changes in the competitive landscape over the next two years. In 2026, industries with high concentration include U.S. metal mineral mining, global semiconductor storage, global semiconductor foundry, and U.S. building materials; relatively dispersed industries include Chinese digital chip design, U.S. oil and gas, and Chinese semiconductor equipment. For 2027, our estimates based on the proportion of revenue expectations show that there is no fundamental change in the industry competitive landscape, but industries with a noticeable decrease in concentration mainly include global semiconductor storage, U.S. metal mineral mining, U.S. oil and gas, and U.S. PCB; industries with a noticeable increase in concentration mainly include global semiconductor foundry, global digital chip design, and Chinese optical modules.
► Changes in investment intensity over the next two years (Chart 16). To eliminate the incomparability caused by different industry-specific fluctuations, this paper uniformly uses the relative investment intensity in the historical series of the industry percentiles, with data for 2026 and 2027 being market consensus expectations.
1) In 2026, based on market consensus expectations, industries with relatively high investment intensity include: global semiconductor storage, global semiconductor foundry, and U.S. building materials in the high concentration group, as well as global digital chip design, U.S. optical modules, U.S. PCB, and U.S. power grid equipment in the medium-low concentration group; industries with relatively low investment intensity include Chinese power grid equipment, optical modules, and semiconductor equipment, all belonging to the medium-low concentration group.
2) In 2027, based on market consensus expectations, the relative investment intensity of global semiconductor foundry and U.S. building materials in the high concentration group, as well as global digital chip design in the medium-low concentration group, remains relatively high; additionally, the investment intensity of Chinese digital chip design in the medium-low concentration group will increase; among industries with relatively low investment intensity, global semiconductor storage in the high concentration group, as well as U.S. PCB, optical modules, and non-ferrous metals in the medium-low concentration group are newly added.
Chart 16: Expected Changes in Relative Investment Intensity in High Prosperity Sectors
Source: Factset, CICC Research Department
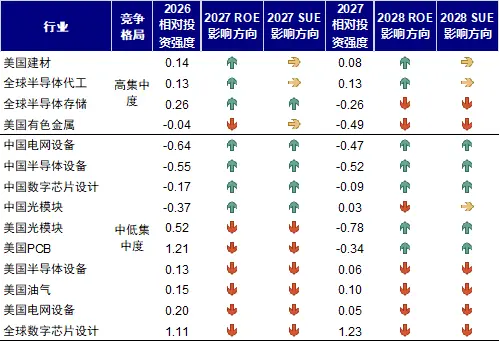
Different combinations of industry concentration and investment intensity have different implications for future returns (ROE) and profits (SUE) (Chart 17): 1) High concentration + high investment intensity: including global semiconductor foundry and U.S. building materials. Due to relatively concentrated supply decisions, high investment does not necessarily evolve into chaotic expansions, but may instead boost ROE and SUE due to technological iteration and balance of quantity and price; 2) Medium-low concentration + low investment intensity: including Chinese semiconductor equipment and power grid equipment. Due to relatively restrained expansion, the increase in quantity has less erosion on price and profit margins, leaving room for future ROE improvement, and SUE is also more likely to maintain relatively high levels. 3) High concentration + low investment intensity: mainly including U.S. non-ferrous metals. Although the competitive landscape helps maintain supply discipline, the lack of strong positive return signals corresponding to significant investment expansion may limit the future improvement of ROE and SUE; 4) Medium-low concentration + high investment intensity: most typically seen in global digital chip design. The relatively dispersed competition makes it easier for company-level expansions to accumulate into industry supply pressure, posing a risk of future ROE decline, and SUE is also more likely to revert from an abnormally high level to historical norms, which is a key area to be cautious about regarding the sustainability of high prosperity.
Chart 17: The Direction of Relative Investment Intensity's Impact on ROE and SUE under Different Competitive Landscapes
Source: Factset, CICC Research Department
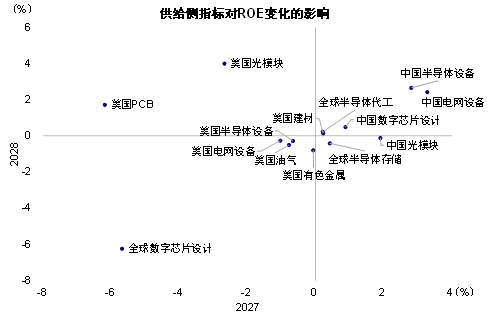
In summary, current investment expectations do not yet pose comprehensive pressure on the prosperity of the global tech industry. However, under different competitive landscapes, the impact of supply expansion on ROE and prosperity will vary: over the next two years, the supply environment is relatively favorable, and capital returns and prosperity will mainly benefit China's semiconductor equipment and power grid equipment; global digital chip design faces significant challenges. Chinese optical modules, U.S. optical modules, and PCBs may benefit in phases; U.S. non-ferrous metals may face pressure in phases (Charts 18-19).
Chart 18: The Impact of Supply-Side on Capital Returns in AI Prosperity Sectors over the Next Two Years
Source: Wind, Factset, CICC Research Department
Chart 19: The Impact of Supply-Side on Profit Prosperity in AI Prosperity Sectors over the Next Two Years
Source: Wind, Factset, CICC Research Department
[1] Boehm and Pandalai-Nayar (2022), American Economic Review
[2] The investment intensity model is: ln(Investᵢ,ₜ/PPEᵢ,ₜ₋₁)=α+β₁Tobin's Qᵢ,ₜ₋₁+β₂ROEᵢ,ₜ+β₃DDᵢ,ₜ+β₄AGEᵢ,ₜ+β₅LEVᵢ,ₜ+β₆VOLPᵢ,ₜ+β₇ln(SIZEᵢ,ₜ)+εᵢ,ₜ
Source
This article is excerpted from: "Can AI's High Prosperity Withstand Supply Challenges?" published on October 19, 2026.
Peng Yifu, Analyst, SAC Certification No.: S0080525120003
Liu Gang, CFA Analyst, SAC Certification No.: S0080512030003, SFC CE Ref: AVH867
Legal Disclaimer
Special Reminder
This public account is not a platform for the release of research reports by China International Capital Corporation Limited (hereinafter referred to as "CICC"). This public account merely forwards some viewpoints from research reports already published by CICC. Subscribers using the information contained in this public account may misunderstand key assumptions, ratings, target prices, and other content due to a lack of understanding of the complete report or relevant interpretations. Subscribers using this information should seek guidance and interpretation from professional investment advisors.
The information and opinions contained in this public account do not constitute offers or solicitations for the purchase or sale of the mentioned securities or financial instruments. Ratings, target prices, valuations, earnings forecasts, and other analyses do not constitute investment advice regarding specific securities or financial instruments at specific prices, times, or market performances. Such information and opinions do not constitute targeted operational advice for any person at any time. Subscribers should evaluate the information and opinions in this public account and make their own investment decisions based on their circumstances, assuming their own investment risks.
CICC makes no express or implied guarantees regarding the accuracy, reliability, timeliness, or completeness of the information contained in this public account. CICC and/or its affiliates bear no responsibility in any form for any consequences arising from reliance on or use of the information contained in this public account.
This public account is intended for CICC's clients in mainland China only. Any subscribers who do not meet the aforementioned conditions are advised to assess the appropriateness of receiving subscription content before subscribing. Subscribing to this public account does not constitute the basis for any contract or commitment, and CICC does not consider subscribers to be clients of CICC solely by virtue of their subscription to this public account.
 Risk warning Risk warning